Reading a spectrum: coherent sampling and FFT leakage
Demonstration content
This is an educational synthetic experiment, not a measured RF result or a claim of professional project experience. Author identity and repository links are pending.
The engineering question
Why does an FFT show energy in many bins when the input contains only one tone? A finite observation does not necessarily contain an integer number of signal periods. Its periodic extension can have a discontinuity, spreading energy across the discrete frequency grid.
Sampling model
For a complex sinusoid sampled at \(f_s\), let
The DFT evaluates the spectrum at \(f_k=kf_s/N\):
If \(f_0N/f_s\) is an integer, the rectangular-window DFT places the tone in one bin (up to floating-point error). Otherwise the sampled Dirichlet kernel distributes it across bins. Zero padding interpolates that spectrum; it does not improve the physical resolution set by observation time.
Experiment architecture
flowchart LR
    A[Synthetic complex tone] --> B[Finite observation]
    B --> C[Rectangular or Hann window]
    C --> D[DFT]
    D --> E[Normalize by window sum]
    E --> F[Compare spectral leakage]
Reproduce the figure
Download the Python experiment. It uses the standard library only. Run from the repository root:
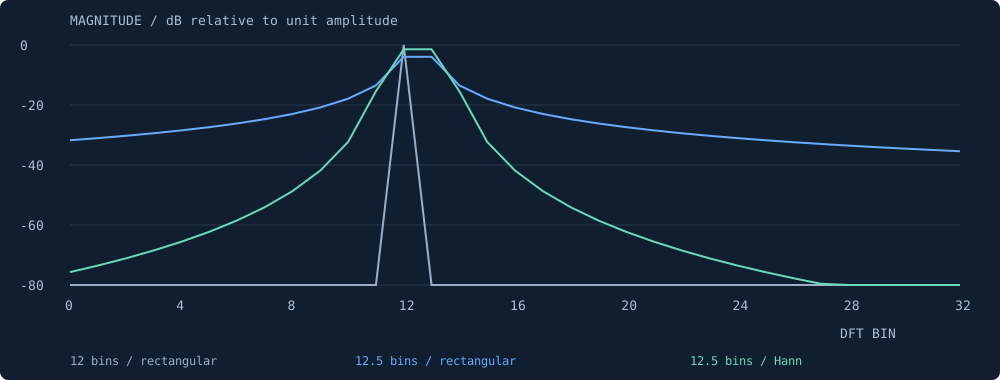
The experiment uses \(N=128\), \(f_s=128\) Hz, and tones at 12 Hz and 12.5 Hz. It computes a direct DFT so that the implementation is easy to inspect; this is not an efficient replacement for an FFT library.
spectrum = [abs(sum(x[n] * w[n] * cmath.exp(-2j * math.pi * k * n / N)
                    for n in range(N))) / sum(w)
            for k in range(N)]
Interpreting the result
The bin-aligned tone has unit amplitude at bin 12. A half-bin offset produces two dominant bins and visible sidelobes. The periodic Hann window suppresses distant sidelobes while widening the main lobe. The normalization by the window sum corrects coherent gain for a bin-centred tone; it does not remove scalloping loss for a tone between bins.
| Decision | Benefit | Cost |
|---|---|---|
| Rectangular window | Narrow main lobe | Higher sidelobes for off-bin tones |
| Hann window | Lower distant sidelobes | Wider main lobe |
| Longer observation | Finer bin spacing | More latency and memory |
Validation and limits
The script asserts the bin-centred peak and numerical off-bin residual, and checks that the Hann window reduces distant-bin energy for the half-bin case. These are synthetic correctness checks. No RF hardware, noise, quantization, Doppler dynamics or execution-time benchmarks are included.
A C++17 companion verifies coherent-bin accumulation with the same sample count. It is a correctness illustration, not an optimized embedded implementation.
References
- NumPy DFT convention — the same forward-transform sign convention used here.
- SciPy Hann window definition — this experiment uses the periodic form.
Related engineering work
Reproducible spectral analysis bench
Source repository: [OWNER/REPOSITORY — configure before publication] (placeholder).